Running the debugger v16
You can perform the following operations to debug a program:
- Step through the program one line at a time.
- Execute the program until you reach a breakpoint.
- View and change local variable values within the program.
Considerations when using the program
These instructions use the standalone debugging method. To start the debugger for in-context debugging, see Setting global breakpoint for in-context debugging.
You can't debug triggers using standalone debugging. You must use in-context debugging. See Setting global breakpoint for in-context debugging for information.
Stepping through the code
Use the tool bar icons to step through a program with the debugger. The icons serve the following purposes:
- Step into. Execute the currently highlighted line of code.
- Step over. Execute a line of code, stepping over any subfunctions invoked by the code. The subfunction executes but is debugged only if it contains a breakpoint.
- Continue/Start. Execute the highlighted code and continue until the program encounters a breakpoint or completes.
- Stop. Halt a program.
Using breakpoints
As the debugger executes a program, it pauses when it reaches a breakpoint. When the debugger pauses, you can observe or change local variables or navigate to an entry in the call stack to observe variables or set other breakpoints. The next step into, step over, or continue operation forces the debugger to resume executing with the next line of code following the breakpoint.
These are the two types of breakpoints:
Local breakpoint — You can set a local breakpoint at any executable line of code in a program. The debugger pauses execution when it reaches a line where a local breakpoint was set.
Global breakpoint — A global breakpoint triggers when any session reaches that breakpoint. Set a global breakpoint if you want to perform in-context debugging of a program. When you set a global breakpoint on a program, the debugging session that set the global breakpoint waits until that program is invoked in another session. Only a superuser can set a global breakpoint.
Setting a local breakpoint
To create a local breakpoint, select the grey shaded margin to the left of the line of code where you want the local breakpoint set. The spot you select must be close to the right side of the margin as in the spot where the breakpoint dot is shown on source code line 12. When the breakpoint is created, the debugger displays a dark dot in the margin, indicating a breakpoint was set at the selected line of code.

You can set as many local breakpoints as you want. Local breakpoints remain in effect for the rest of a debugging session until you remove them.
Removing a local breakpoint
To remove a local breakpoint, select the breakpoint dot. The dot disappears.
To remove all of the breakpoints from the program that currently appears in the Program Body frame, select the Clear all breakpoints icon.
Note
When you perform any of these actions, only the breakpoints in the program that currently appears in the Program Body panel are removed. Breakpoints in called subprograms or breakpoints in programs that call the program currently appearing in the Program Body panel aren't removed.
Setting a global breakpoint for in-context debugging
To set a global breakpoint for in-context debugging:
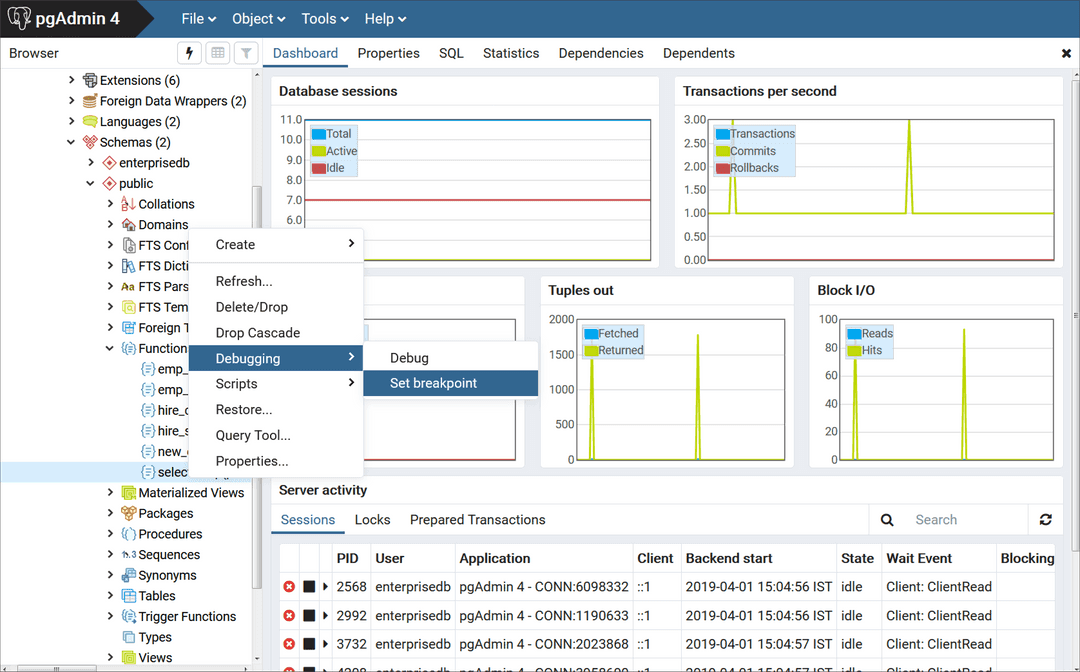
In the Browser panel, select the stored procedure, function, or trigger on which you want to set the breakpoint.
Select Object > Debugging > Set Breakpoint.
To set a global breakpoint on a trigger:
Expand the table node that contains the trigger.
Select the specific trigger you want to debug.
Select Object > Debugging > Set Breakpoint.
To set a global breakpoint in a package:
Select the specific procedure or function under the package node of the package you want to debug.
Select Object > Debugging > Set Breakpoint.
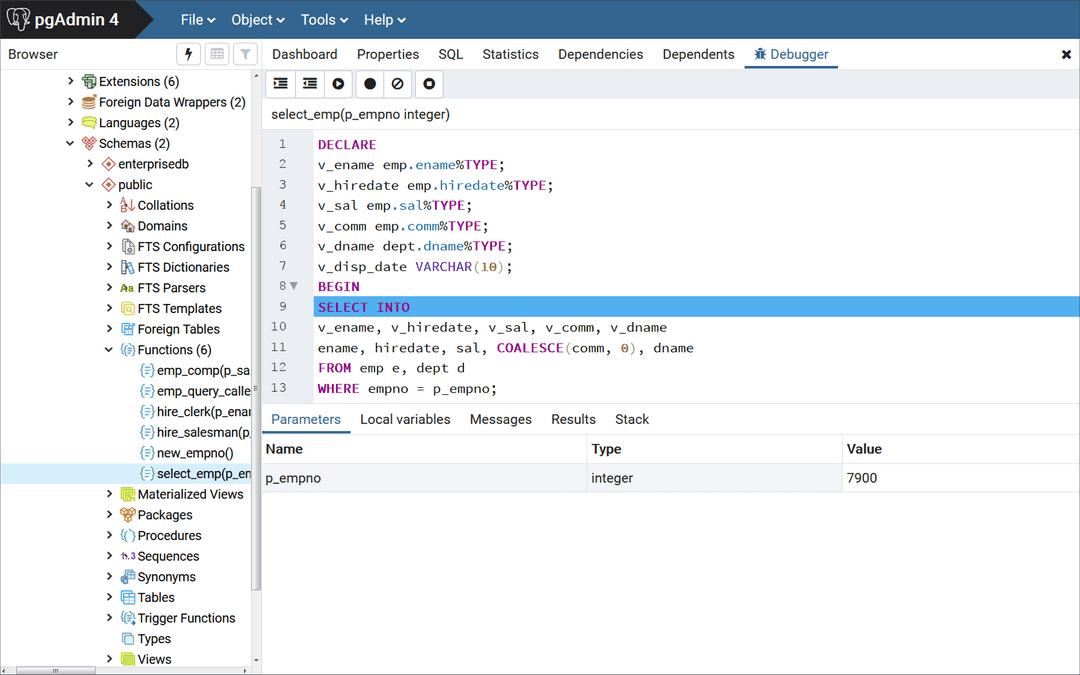
After you select Set Breakpoint, the Debugger window opens and waits for an application to call the program to debug.
The PSQL client invokes the select_emp function on which a global breakpoint was set.
$ psql edb enterprisedb
psql.bin (14.0.0, server 14.0.0)
Type "help" for help.

edb=# SELECT select_emp(7900);
The select_emp function doesn't finish until you step through the program in the debugger.

You can now debug the program using the operations like step into, step over, and continue. Or you can set local breakpoints. After you step through executing the program, the calling application (PSQL) regains control, the select_emp function finishes executing, and its output is displayed.
$ psql edb enterprisedb
psql.bin (14.0.0, server 14.0.0)
Type "help" for help.

edb=# SELECT select_emp(7900);
INFO: Number    : 7900
INFO: Name      : JAMES
INFO: Hire Date : 12/03/1981
INFO: Salary    : 950.00
INFO: Commission: 0.00
INFO: Department: SALES
 select_emp
------------
(1 row)
At this point, you can end the debugger session. If you don't end the debugger session, the next application that invokes the program encounters the global breakpoint, and the debugging cycle begins again.